Demos 0:44
Turn a table into charts, then keep the tool
Watch the side panel turn Yahoo Finance tables into interactive charts with code you approve, then keep that code as a tool for the page.
What was asked
can you make these data tables into nice looking visualized charts
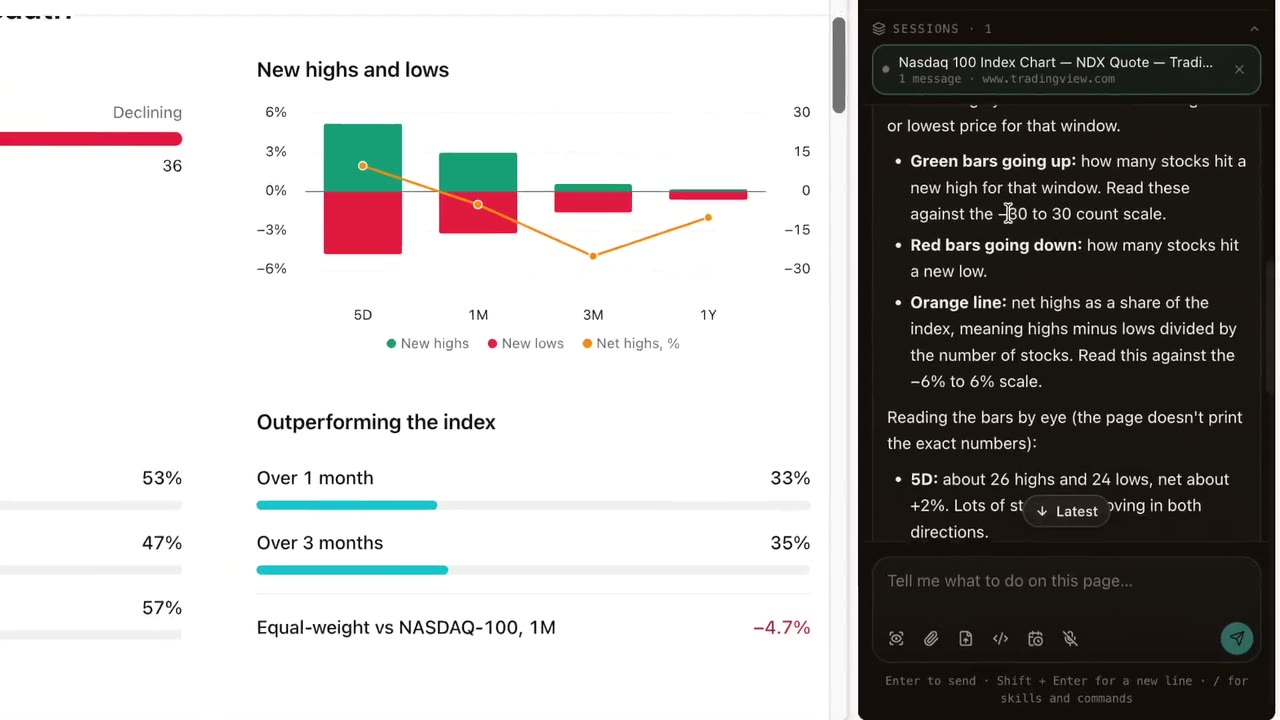
Point at the valuation tables on a Yahoo Finance quote page and ask for charts. The agent writes the code, you read it and allow it, and the numbers become bar and line charts inside the page itself. Then it offers to keep the code as a tool for that page, so next time no agent is needed at all.
What happens
-
01
You point at the Valuation Measures table with A-Eye and ask out loud.
-
02
The agent reads the tables and writes code that draws them as charts.
-
03
You allow it. Bar and line charts appear in the page, with values on hover.
-
04
It offers to keep the code as a tool for finance.yahoo.com/quote, and you say yes.
Give your browser a superpower.
Free and open source. No API key, no subscription, no account. A fresh install connects to nothing until you pair it yourself.
npx browsentic setup